The median list price for Sherman Oaks, CA is $2,499,000, with the Market Action Index (MAI) at 32, reflecting a Slight Seller’s Advantage. Inventory holds steady at 156 homes, maintaining a balanced pace between supply and demand. Stay informed with the latest Sherman Oaks real estate trends.
Market Action Index
Current MAI: 32
Last Month’s MAI: 32
Status: Slight Seller’s Advantage
The market remains relatively stable. While prices are not moving significantly, low inventory keeps sellers in a favorable position. A shift in demand could tip the balance in either direction—watch the MAI closely.
Market Narrative
Sherman Oaks is currently experiencing equilibrium between inventory and sales. Prices have leveled out in recent weeks, but seller advantage persists due to constrained inventory. If buyer activity increases, pricing could trend upward.
Real-Time Market Profile
-
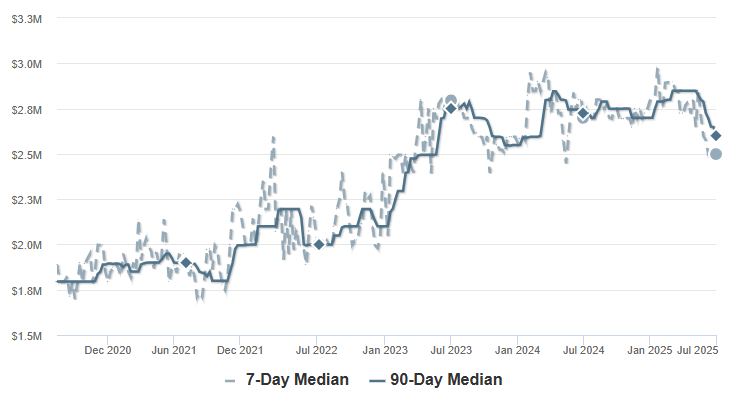
Median List Price: $2,499,000
-
Median Price of New Listings: $2,342,000
-
Price per Square Foot: $847
-
Average Days on Market: 91
-
Median Days on Market: 63
-
Price Decreased: 33% of listings
-
Price Increased: 1% of listings
-
Relisted Properties: 25%
-
Inventory: 156 properties
-
Median Rent: $9,098/month
Market Segments
Sherman Oaks is segmented into four pricing tiers, each representing roughly 25% of the market:
| Median Price | Sq. Ft. | Lot Size | Beds | Bath | Age | New | Absorbed | DOM |
|---|---|---|---|---|---|---|---|---|
| $3,999,999 | 4,674 | 0.25 - 0.5 acre | 5 | 5.5 | 19 | 0 | 5 | 77 |
| $2,945,000 | 3,663 | 0.25 - 0.5 acre | 4 | 4 | 49 | 1 | 2 | 84 |
| $2,325,000 | 2,778 | 6,500 - 8,000 sqft | 4 | 3.5 | 69 | 0 | 2 | 63 |
| $1,699,000 | 2,000 | 6,500 - 8,000 sqft | 3 | 2.5 | 73 | 1 | 5 | 42 |
Conclusion
Sherman Oaks continues to lean slightly in favor of sellers. While pricing remains steady, the balance could shift with any sustained change in inventory or buyer demand. Keep an eye on market indicators for potential movement.